Back to Dude Intelligence for Education Main Menu
This data is updated every month and includes a rolling 12 months worth of data. For example, if you are viewing your KPIs in March 2017, then you will see data from the first of March 2016 through the end of February 2017.
- To download an image of the graph, click on the download icon (
 ).
). - To expand the graph you are viewing, click on the fullscreen icon (
 ).
). - To export your KPI data into an Excel spreadsheet, click on the Excel icon (
 ). *Note: This will only export the data, not the graphs.
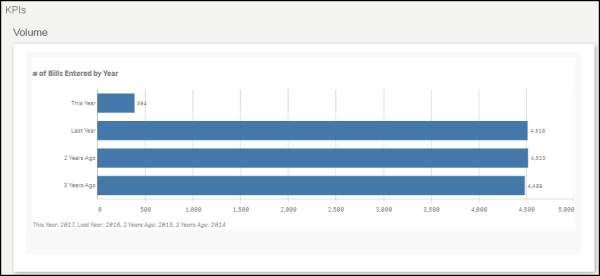
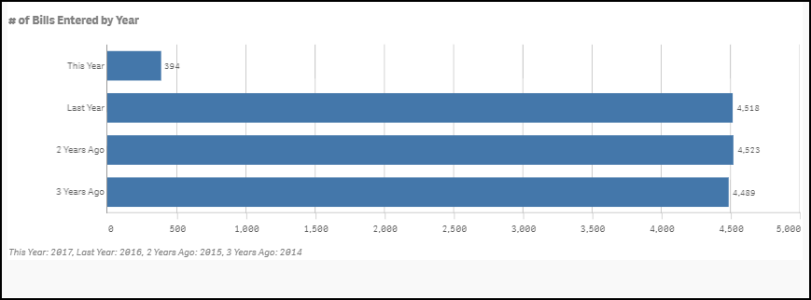
Volume KPIs
Volume KPIs show the amount of bills you are tracking in your UtilityDirect account.
Shows the total number of bills entered for the past three calendar years plus the current year.
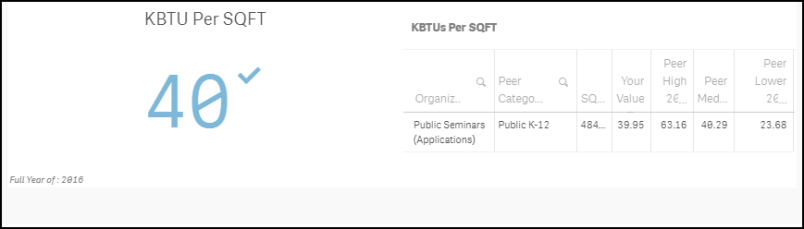
Efficiency KPIs
Efficiency KPIs show how well your organization is performing according to specific metrics.
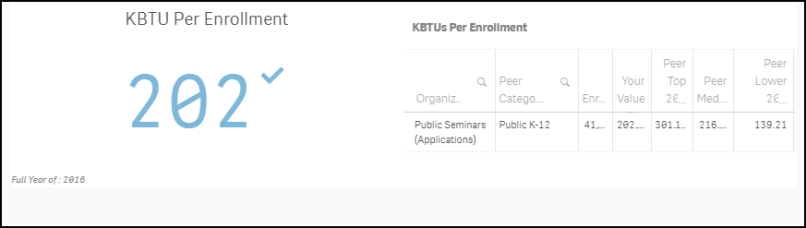
Shows the total number of KBTUs used for the previous full year divided by the total square footage of your Locations.
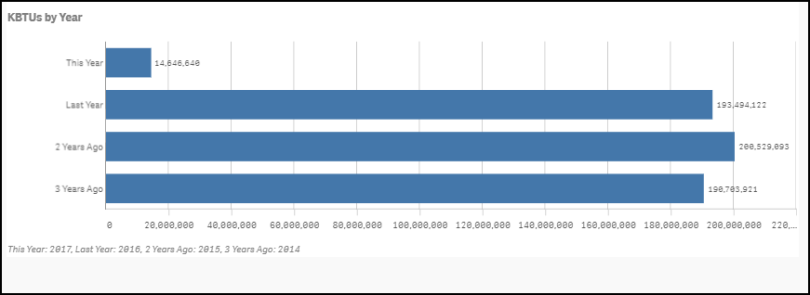
Shows the total number of KBTUs used for the past three calendar years plus the current year.
Cost KPIs
Cost KPIs show costs related to your various utilities.
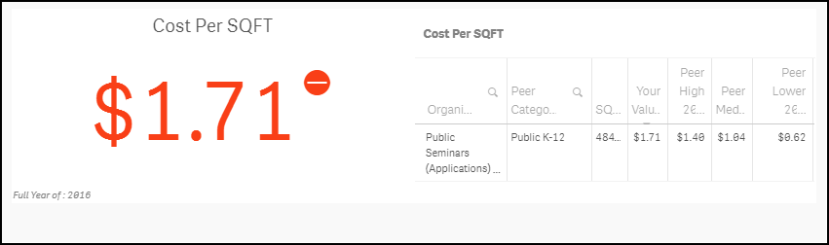
Shows the total cost of utility bills for the previous full year divided by the total square footage of your Locations.
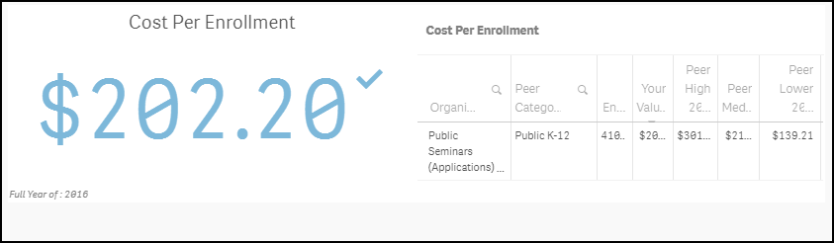
Shows the total cost of utility bills for the previous full year divided by your student enrollment from the NCES.org database.
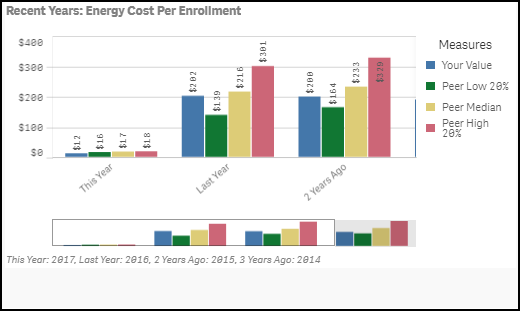
Shows the total energy cost for the past three calendar years plus the current year divided by your student enrollment from the NCES.org database.
Blue - The blue bar displays your organization's value.
Green - The green bar displays peers in the top 20%.
Yellow - The yellow bar displays peers that are performing in the median or average range.
Red - The red bar displays peers that are performing below average.
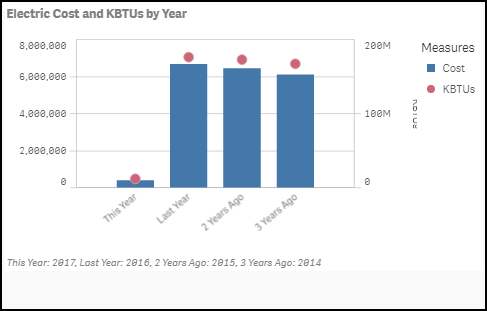
Shows the electric cost and KBTUs for a given calendar year.
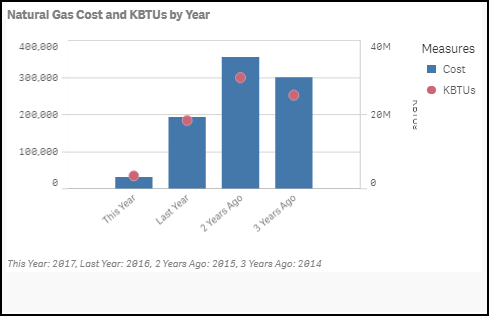
Shows the natural gas cost and KBTUs for a given calendar year.
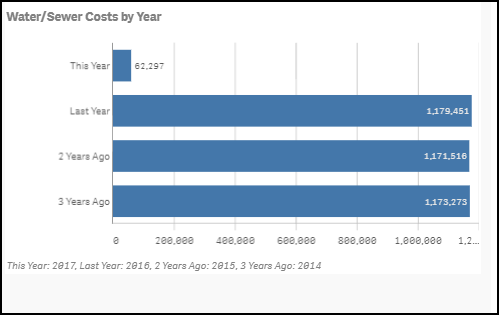
Shows the water and sewer costs for a given calendar year.
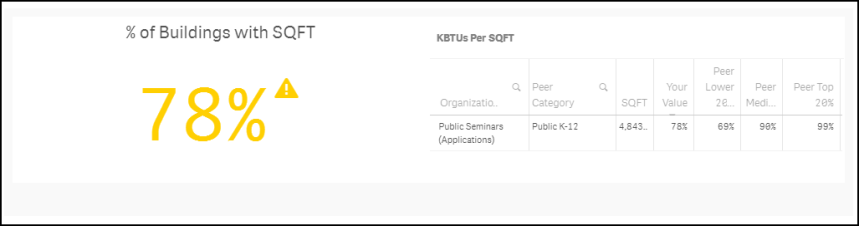
Data Quality KPIs
This percentage displays the number of buildings with square footage entered divided by the total number of buildings.